Highlights
- Ontario Cancer Profiles allows users to generate customized Ontario and Local Health Integration Network (LHIN)-level cancer statistics.
- As an example, the prevalence of smoking and all-cancer mortality across regions in Ontario can be mapped and examined using this tool.
- Data from the tool can be used to plan targeted regional cancer prevention and control efforts that meet the unique needs of each LHIN.
Cancer Care Ontario recently released Ontario Cancer Profiles, a self-serve, interactive mapping tool that gives instant access to recent, customizable provincial and regional Ontario statistics on cancer burden, risk factors, social determinants of health and screening indicators. Ontario Cancer Profiles was created to provide the public health community, healthcare providers, researchers and other stakeholders with Ontario cancer surveillance, population health and screening data that can inform the planning, design and delivery of regional cancer prevention and control efforts.
The tool can be used to generate customized statistics on cancer incidence and mortality for 24 cancer types, 10 modifiable risk factors and social determinants of health, and screening participation gaps for Ontario’s three cancer screening programs. It allows users to produce downloadable maps or graphs, or export the data for further analysis. Users can also explore the relationship between modifiable risk factors and cancer mortality at the present time or with a six- to seven-year lag time.
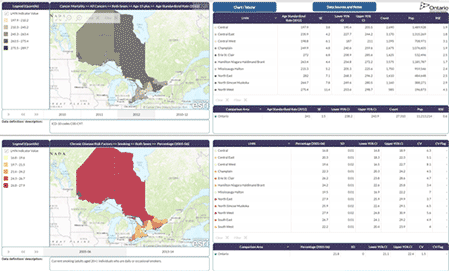
For example, the prevalence of smoking across regions in Ontario can be mapped and examined in relation to all-cancer mortality for different time periods (see snapshot of the tool below). After applying the tool, it becomes clear that there is large variation in smoking prevalence and all-cancer mortality, and a general correlation between the two among health regions. Tobacco use is the single greatest avoidable risk factor for cancer; it is a major preventable cause of 16 cancer types and accounts for nearly a quarter of cancer deaths worldwide.[1][2]
Smoking and mortality rates are generally lowest in the central part of the province and highest in the north. Within Ontario, the five LHINs with the highest prevalence of smoking in 2005–2006 (Erie St. Clair, North East, North Simcoe Muskoka, North West and South East) had the highest all-cancer mortality rates in 2012 among adults. The mortality rates in these regions were significantly higher than the provincial rate. The six LHINs with the lowest prevalence of smoking (Central, Central East, Central West, Mississauga Halton, Toronto Central and Waterloo Wellington) had the lowest rates of all-cancer mortality.
Cancer mortality is influenced by the incidence of cancer, socio-demographic factors, screening behaviour and treatment options.[3] The geographic variations in all-cancer mortality shown in this example may reflect past smoking rates in addition to differences in socio-demographic, screening and treatment factors. Even stronger correlations between smoking and all-cancer mortality might be seen if a longer lag time were applied because it takes many years for smoking-related cancer to develop.
The data from this tool could be used to target regional cancer prevention and control efforts. By correlating cancer burden data with data on risk factors, social determinants of health and cancer screening participation gaps, the unique needs of each LHIN can be better understood.